Jump to: Part 1, Part 2, Part 3, Part 4, Part 5, Part 6, Part 7, Part 8, Part 9, Part 10, Part 11, Part 12, Part 13. Part 14.
Japanese Candlesticks– The History Of The Eternal Battle Between The Bulls And The Bears
Deciphering texts in Latin, mathematical analysis exams in late uni years, the calculation of the permissible loads on bridge buttresses and reading stock charts are akin to magic for most people. The exchange terminal with its myriad charts, indexes and multi-colored markers can evoke either admiration or a panic attack.
But no matter what trading platform you are on, the basic information about the trading process will always be presented with the help of Japanese candlesticks, which are the standard for most exchange platforms and monitoring systems. Each candlestick on the chart shows the range of price movement for a certain period and consists of a body that denotes the opening price and the closing price, and the tail (shadow), which shows the price minimum and maximum for the period.
“Every morning, when markets open, a new fight begins in the eternal struggle between the bulls and the bears. The purchases of the bulls push the market up, and the sales of the bears push it down. Each bar or streak on the charts reflects this ongoing struggle.”
Alexander Adler
From the preface to the book
Japanese Candlestick Charting Techniques
Steve Nison
Steve Nison’s work that came out in 1998 became a reference book for traders and analysts around the world. “Graphical analysis is an analysis of crowd behavior,” as the manual says. And in this article, we will look at some of the patterns identified by the author.
Types Of Candlesticks: Bull, Bear, Spinning Tops and Dojis
The method of working with Japanese candlesticks suggests that the most significant price movements are the body of the candle, while in the European tradition, careful attention was paid for a long time to the extremes of a certain period. In modern markets, candlesticks are depicted in green, which means that in a particular period, the bulls have prevailed on the market, or red, in which case there were more bears. But there are also lesser known types of candlesticks, like the spinning tops, or candlesticks with small bodies, which are usually neutral and appear during a narrow trade corridor.
There are candlesticks that have no body at all, the so-called dojis.

A doji is considered to be a pronounced signal of a change in a trend, and the likelihood of a reversal increases if a subsequent price movement confirms this signal. Dojis are rarely found on the cryptocurrency market, which adds weight to them as indicators. They can point to the ceiling of the market, especially when they appear after a long green candlestick.
“The doji’s amazing ability to signal a trend reversal is lost with declining prices. Perhaps the reason is that the doji symbolizes the equality of the forces of the bulls and bears. In a situation of such uncertainty, the market can move down under its own weight. Thus, the upward trend is likely to change after the appearance of the doji, and the downward trend may continue.”
Steve Nison
Japanese Candlestick Charting Techniques
Reversal And Trend Continuation Models
Not only dojis indicate a change in trend on the market. It is important to note that the trend reversal signal indicates that there is a possibility of a change, and not necessarily in the opposite direction.
“One of the most important commandments of any trader states that a new position (at a reversal signal) should be opened only if this signal is consistent with the direction of the main trend. Suppose, for example, that a reversal pattern is formed at the top on a bull market. Since the main trend is still upward, it is not recommended to open short positions based on this bearish signal. But it is best to close long positions in this situation. The same signal on a bear market would be a sufficient reason to open short positions.”
Steve Nison
Japanese Candlestick Charting Techniques
Candlesticks with short bodies and a long lower tail are called a hanging hammer or hanging man depending on the trend. The appearance of such a long-tailed candlestick at a downtrend can be a signal for a quick change in sentiment towards bullish, in which case the candlestick is called a hanging hammer. Otherwise, it is called a hanging man.

Most of the signals appearing on the candlestick charts are not based on single candlesticks, as is the case with the hammer and the hanged man, but on their combinations. The engulfing pattern is one of the main combinations that signal a reversal during a pronounced upward or downward trend. It is formed by two candlesticks in the case when the body of the second candlesticks absorbs the first one. This model suggests that the pressure of the buyers has exceeded the pressure of the sellers, or vice versa.
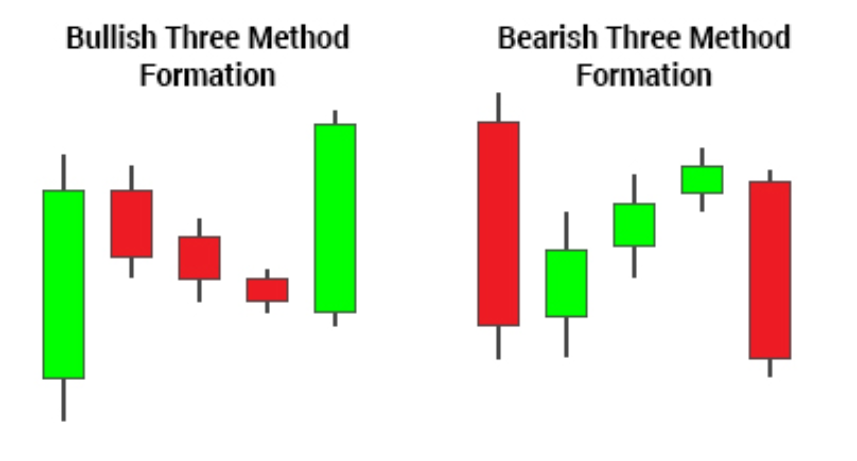
Naturally, the market slows down after a sharp rise in price over a period of time, and during this period, on the charts we can see a group of candlesticks with small bodies. When a group of short, red candlesticks (ideally three of them) follows a long green candlestick, and they do not go beyond the price range of the first green candle, the market is said to be stopping to catch its breath. This situation is called the Three Methods model, which can be either ascending or descending.
Due to the continuity of trading on cryptocurrency exchanges, many models here turn out to be irrelevant, since the closing price of the previous candlestick is ideally minimally different from the opening price of the next one. Many of the methods described by Steve Nison are based directly on the difference between the opening and closing prices and the so-called windows.
The use of Japanese candlesticks, like any other method of graphical analysis, involves subjectivity, and the same graph can be interpreted by two people differently. In this article, we have outlined the methods most applicable to the cryptocurrency market. For a complete picture of working with candlesticks, however, we recommend reading Steve Nison’s work.
“Be flexible when reading graphs. Evaluation of the aggregate signals of technical indicators may be more significant than the data of a single candlestick model. A bullish candlestick signal on a strong bear market should not be considered as a buy signal. A bullish candlestick model is the only buy signal, which appears on a growing market, especially if it is supported by other technical signals.”
Steve Nison
Japanese Candlestick Charting Techniques
Candlestick Charts In MoonTrader
Working with candlesticks requires close attention from the trader, just as work with all market signals in general. Most market participants who trade manually in the background have no access to detailed technical analysis, and therefore many resort to using signals.
The graphs in the MoonTrader terminal display the signals to buy and sell an asset, which are formed on the basis of technical and graphical analysis. The platform’s functions allow customizing the appearance of the charts, selecting the format for displaying candlesticks, adjusting timeframes, or selecting the list of displayed indicators. Traders can also put marks directly on the chart, build trend lines on it, measure the number of candlesticks and gain returns in a certain area.

Informative charts and a variety of tools for hedging risks will make trading with MoonTrader a convenient, understandable and enjoyable process. We are always happy to help you understand the functioning of the exchange and answer your questions.
Jump to: Part 1, Part 2, Part 3, Part 4, Part 5, Part 6, Part 7, Part 8, Part 9, Part 10, Part 11, Part 12, Part 13. Part 14.
Check us out at https://moontrader.com
Twitter: https://twitter.com/MoonTrader_io
LinkedIn: https://www.linkedin.com/company/19203733
Reddit: https://www.reddit.com/r/Moontrader_official/
Telegram: https://t.me/moontrader_news_en