
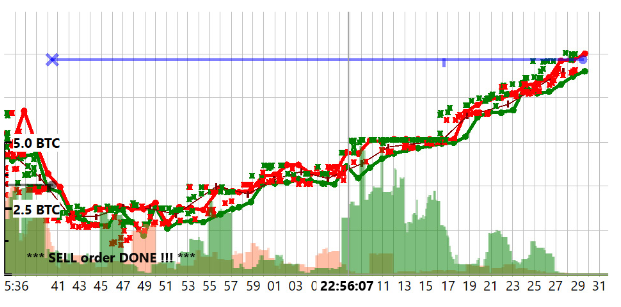
Thanks to the API connection to the exchange, the terminal receives stream data of all filled orders on the exchange as soon as they were processed by the exchange servers and immediately displays them on the chart.
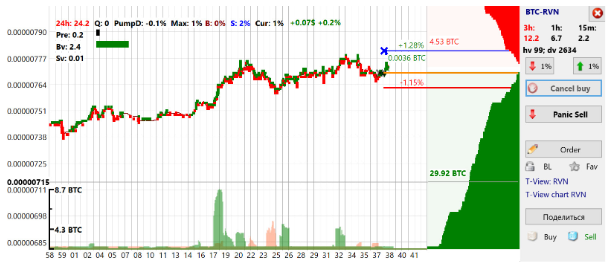
Thus, the visualization of the current state of the market is provided in real time with an accuracy of tens of milliseconds and as detailed as displaying each order on the chart.
And check us out on:
Twitter: https://twitter.com/MoonTrader_io
LinkedIn: https://www.linkedin.com/company/19203733
Reddit: https://www.reddit.com/r/Moontrader_official/
Telegram: https://t.me/moontrader_news_en